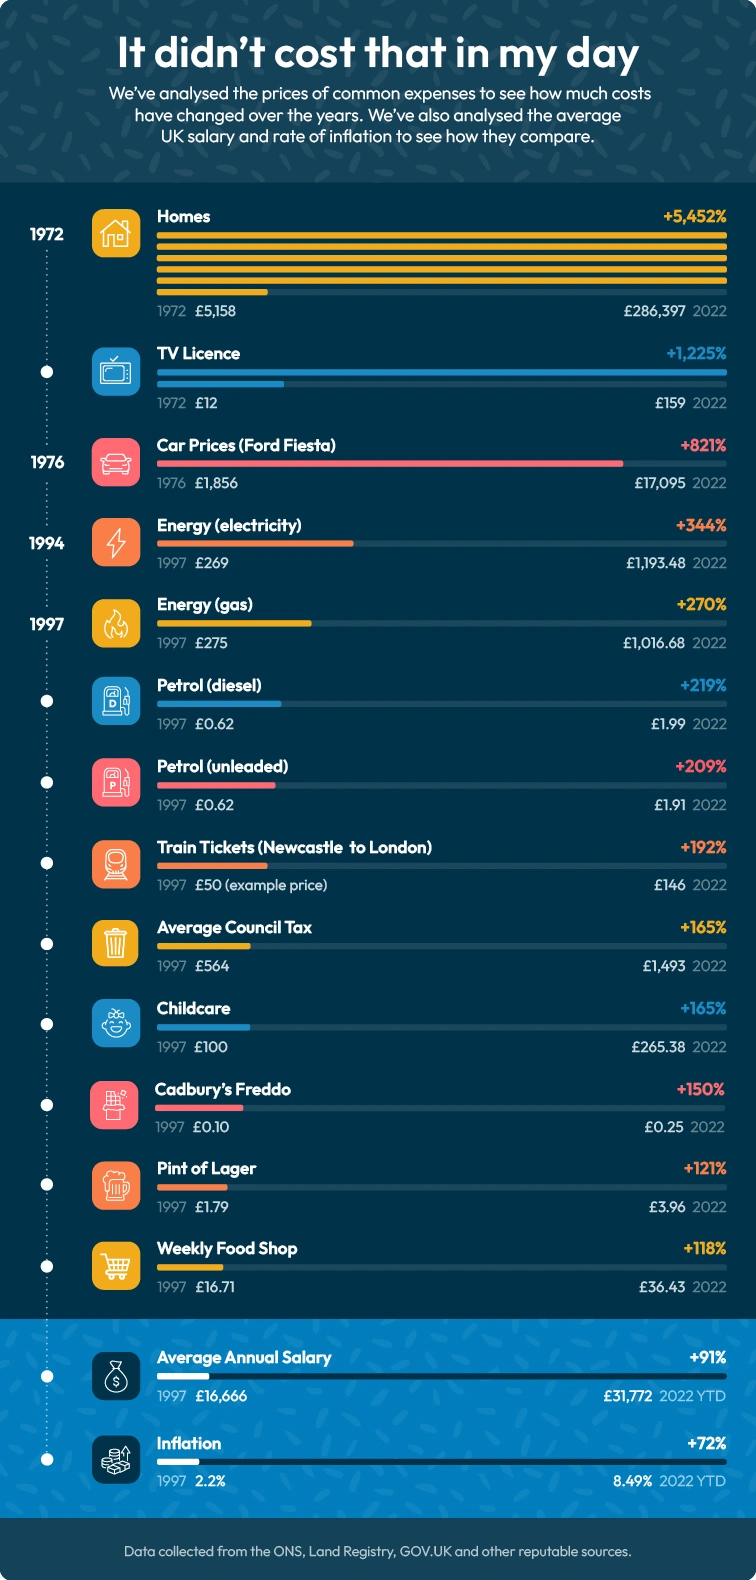
The cost of living is increasing at the highest rate in 40 years. People are feeling the pinch across the board, with energy bills, fuel prices and childcare costs, to name but a few, all at record highs.
To build a broader picture of the rising costs, we’ve analysed how the prices of commonplace items have changed over the years, including houses, transport, groceries and more. We’ve compared these expenses over time, factoring in inflation and average wages.
We’ve also provided money-saving tips to help you make the most of your money, even at times like this, when things are particularly tight.
Key findings:
- the price of the average UK home has increased by 5,452% in 50 years
- car prices have risen significantly above the rate of inflation
- at their peak in June 2022, petrol and diesel prices were 40% higher than in 2021
- the average UK wage has doubled over the last 25 years, but is far from keeping pace with current inflation
What is inflation?
In simple terms, inflation is the word used for the general increase in the price of goods and services, and how this reduces the purchasing power of money.
The Bank of England has set a 2% target for annual inflation, which would deliver a slow and steady increase in prices each year. However, the actual rate varies depending on the economic climate. In July 2022, the rate of inflation was 10.1%, a 40-year high. It is currently expected to peak at 13% towards the end of 2022.
How is inflation calculated?
In the UK, the official measures of inflation are calculated by the Office for National Statistics. They do this by checking the prices of over 700 things that people commonly spend money on, from small items like loaves of bread to bigger purchases like holidays.
The prices of these items are used to create indices such as the Consumer Price Index (CPI) and the Retail Price Index (RPI), which are then compared to the previous year’s data to measure inflation over a set period of time.
House prices have increased by more than 5,400% in 50 years
By analysing HM Land Registry data, our research uncovered that the average cost of a home in the UK has risen by 54 times since 1972. The average price of a home in the UK 50 years ago was just £5,158, while in June 2022, it was a whopping £286,397, with prices in London almost double at £537,920 on average.
Based solely on the average inflation rate of 5.74% per year since 1972, the average UK home in 2022 would be valued at a mere £78,567.72. This means the typical UK home is over £200,000 more expensive than if prices had risen solely in line with general inflation.
These figures suggest that it may take a lot more than giving up Netflix and takeaway coffee to get on or move up the property ladder, especially with first-time buyers in England paying out, on average, £239,418 for their first home.
House prices have shot up by 22% since the pandemic
While house prices have been rising more rapidly than the general rate of inflation for decades, this latest property boom was triggered in part by the pandemic lockdowns, with home prices increasing by 23.5% between December 2019 and June 2022. Being forced to spend more time at home prompted many people to re-evaluate what they wanted and needed from their homes. In particular, the shift towards remote working and therefore needing home office space has changed the way we use the space we have, as well as allowing many to relocate away from city centres.
House prices are likely to continue to increase in the near future, with a move towards aggressive bidding wars and housing hotspot waiting lists looking likely.
TV licences have increased in cost by over 1,225% - but could be more
Something that’s often complained about is the cost of a TV licence (at least according to the tabloids). However, despite increasing by a huge 1,225% in the last 50 years, your licence is actually cheaper than it would be had it risen solely in line with inflation.
Starting at £10 per year for a colour TV in 1968 (or just £5 for a monochrome TV licence) and rising to £12 by 1972, TV licences are currently £159 per year, the price set in 2021. But with inflation averaging 5.74% per year over the last 50 years, they would be around £182.79, had prices risen at this rate.
While this may seem like we’re getting a good deal, it’s worth remembering that the way we watch TV has changed significantly over the last 50 years. Many of us now pay for at least a couple of streaming services as well as – or instead of – a TV licence, making our TV habits more expensive than they may appear.
Think you spend too much on TV? Try our tips and see if you can save £100s a year on streaming services.
Car prices have increased by 821% since 1976
Car prices have increased by a startling 821% since 1976. We looked at the price of one of the UK’s bestselling cars, the Ford Fiesta, and tracked the cost of a basic model since its launch 46 years ago.
At the time of its release, a Fiesta was great value at £1,856. Nowadays, it’s still good value for money, but will set you back £17,905 for the latest model.
Based on average inflation of 5.03% per year between 1976 and 2022, a brand-new Fiesta could be costing you £15,422. This means we’re paying £1,672 more than inflation-level prices. But, considering how much car technology and safety have advanced over the years, we may not be getting such a bad deal!
Petrol prices have gone up by nearly five times in 25 years
Petrol and diesel prices frequently make the headlines, but especially in recent months. They're a key contributor to the cost of living crisis in the UK, with prices rising by more than 40% in the last year alone.
Although fuel prices have started to decline in recent weeks, when they peaked at the end of June 2022, they had reached 191.25 pence per litre of unleaded petrol and 199.02 pence per litre of diesel. That’s an increase of 209% and 219% respectively since 1997.
When compared to the rate of inflation, today’s fuel far exceeds the prices we’d see had they risen at the same rate as general inflation. Back in 1997, fuel prices were fairly evenly matched, with unleaded petrol costing about 61.82 pence per litre on average, and diesel costing only a fraction more at 62.47 pence per litre. If those prices had risen in line with inflation over the last 25 years (3.03%), unleaded petrol would cost about £1.30 per litre, and diesel would cost £1.31.
Electricity bills have shot up by 344% in 25 years
The hike in energy prices is, arguably, the leading driver of the current cost of living crisis. Rising wholesale energy prices, particularly gas, pushed the energy price cap up by a record-breaking 54% in April 2022, with further dramatic increases forecast over the autumn and winter.
The average household’s electricity bill, taking into account the current price cap and standing charge, is estimated to be £1,193.48 annually. This is more than four times the annual cost of electricity 25 years ago, when the average household’s annual electricity bill was £269.
This means that bills have risen at more than double the general rate of inflation over this period. But, it’s important to bear in mind that our changing usage will play a role in rising bills, as well as increasing energy costs.
Had bills increased at a rate of 3.03% per year between 1997 and 2022 and our consumption rates stayed the same over the course of time, electricity bills would currently be around £565 for the year.
Gas bills have more than tripled since 1997
It’s not just the cost of electricity that’s rising rapidly. The average gas bill has also shot up by 270% in 25 years. Prices increased from £275 annually in 1997 to £1,016.68 in April 2022 following the energy price cap rise.
Had prices risen at the same rate as general inflation over the last 25 years, we’d be paying £438.88 less at around £577.80 per year. The increased prices we’re paying for gas are mostly down to high wholesale costs, which have risen significantly over the last year or so. Reasons for the rise include increased demand as the global economy recovers from the pandemic, and limited supply.
We’re paying £400 more for council tax than prices with inflation
From 1997 to 2022, the average council tax bill increased from £564 to £1,493, a rise of 165%. If our council tax bills rose in line with inflation over the last 25 years, we’d be paying £1,185.01 per year on average. So, we’re actually paying over £300 more.
While the £150 council tax rebate that the majority of UK residents have received recently softens the blow of this a little (for this year), we’re still paying more than double the council tax than we were paying 25 years ago.
The price of childcare has increased by 165% in 25 years
Childcare has also shot up in the last 25 years, with prices for an under two-year-old rising by 165% since 1997. Back then, prices were just over £100 per week but have shot up to £265 per week in 2022. Had costs risen in line with general inflation, costs would be expected to be around £210 per week.
Childcare cost increases peaked in 2009, when they rose by a huge 12% compared to the previous year. Another sharp rise followed in 2018, when prices went up by 7% year on year.
It has been reported that 99% of parents are finding the current cost of living crisis more challenging because childcare is so expensive, and one-third of women barely break even when working and paying for childcare. This has led to a recent resurgence of mothers leaving employment to care for their families, and it marks the first time in decades that the number of women leaving the workforce for this reason has started to rise.
Freddos have more than doubled in price since the 1990s
The Freddo is the inflationary measurement tool of choice for people who see the economy in bars of chocolate. Many remember the glory days of the 1990s when they were just 10 pence a bar and shudder at the thought that we now have to cough up 25 pence (if you’re lucky) for a chocolate frog.
Since the Freddo’s launch in 1994, inflation has averaged a rate of 3.00% per year. Had the cost of Freddos risen at the same rate, they should be around 23 pence a bar, meaning we’re paying two pennies too many.
You could also consider the price per 100 grams of Freddo, which has increased a lot over the years:
|
Year
|
Weight
|
Price per 100 grams
|
|
1994
|
17 grams
|
£0.59
|
|
2007
|
20 grams
|
£1.00
|
|
2022
|
18 grams
|
£1.39
|
Even though we’re getting an extra gram of chocolate compared to the original, this doesn’t make up for the price of these little chocolate bars!
Train tickets have increased by 146% since 1997
It’s not just travelling in your car that’s become more expensive. Train tickets have also increased in price, by a whopping 146% since 1997. If you were paying £50 for a ticket from Newcastle to London in 1997, it’d be around £146 today. If prices were to have increased with inflation, they would be around £105.05. This creates a difference of over £40!
Train ticket prices are usually increased each January, using the previous July’s Retail Prices Index (RPI) as the basis for the increase. When ticket prices increased by 3.8% across the UK (compared to the previous year) in 2022, this represented the biggest increase in rail fares since 2013. However, with the RPI for July 2022 being 12.3% and set to increase further, another record-breaking price rise looks as though it’s on the cards for 2023.
Pints have more than doubled in 25 years
Using government data, we’ve confirmed that you may be paying too much for a pint at your local if you compare the price with the rate of inflation. A pint of lager would have set you back just £1.79 in 1997 but is now a comparably eye-watering £3.96 on average in the UK.
Not only is that an increase of 121% in 25 years, it’s also higher than the average rate of inflation over this period. Based on average inflation of 3.03% per year since 1997, a pint should be around £3.76 – 20p less than the actual price.
It’s probably not the best argument for getting a cheaper pint in your local, but it’s worth a try!
We’re spending over £1,000 more a year on the weekly shop than in the late 90s
Food and non-alcoholic beverages are a significant contributor to rising inflation, with prices rising by 9.8% year on year in June 2022 according to Asda’s income tracker. So, it probably comes as no surprise to find that compared to 25 years ago, we’re spending much more on food than we used to.
In fact, we’re now spending more than double the amount we spent in 1997. Back then, the average weekly food shop per person was just £16.71. But, by June 2022, the average had risen to £36.43. That’s a huge 118% increase and equates to spending £1,025 more on food, per person, per year.
If you look at inflation over this period, which averaged 3.03% per year, your food shop would be £35.11 per person, per week had costs risen solely in line with this measure. This means we’re spending £1.31 more per week, or £68.12 more per year, per person. But, it’s important to remember that our shopping habits have likely changed over time, so we may not be able to blame our higher spending on the rising cost of goods alone.
How the cost of groceries has changed over time
To demonstrate how the prices of specific, popular items have changed over the last 25 years, we compared the prices of a few common items then vs now. Check out the prices below:
|
Product
|
July 1997 price
|
July 2022 price
|
Percentage change
|
Price if increased with inflation
|
|
100g instant coffee
|
£2.08
|
£3.38
|
62.50%
|
£4.37
|
|
Loaf of white bread
|
£0.53
|
£1.24
|
133.96%
|
£1.11
|
|
Pint pasteurised milk
|
£0.35
|
£0.59
|
68.57%
|
£0.74
|
|
Fresh chicken kg
|
£2.60
|
£3.25
|
25.00%
|
£5.46
|
|
1 kg bananas
|
£1.01
|
£0.91
|
-9.90%
|
£2.12
|
|
Cauliflower
|
£0.64
|
£0.98
|
53.13%
|
£1.34
|
As you can see, with the exception of bread, many of our staple grocery items would be more expensive than they currently are had prices risen solely in line with inflation over the last 25 years. And, bananas are cheaper than they were 25 years ago!
So, despite recent price rises, we’re still getting a relatively good deal on some items, at least.
The average UK salary has more than doubled since 1997
The average UK salary for full-time workers has nearly doubled in 25 years, increasing from £16,666 in 1997 to £31,772 in June 2022. On the surface of, this may not seem that bad, especially when you consider that taxation rates have changed for the better over this period and our take-home pay should be a greater portion of our wages than it was 25 years ago.
However, despite the increases, salaries are not keeping pace with rising prices. In fact, the real value of UK workers’ pay is falling at the fastest rate in 20 years. If you compare salary figures to the likes of house prices or, in fact, to everyday expenses such as energy bills and groceries, the steep increases in these areas mean that even inflation-beating salary increases aren’t going far enough to keep up with the escalating cost of living.
Five ways you can save money, despite the increasing cost of living
- Check the price per weight - When you’re doing your weekly shop, compare items based on the cheapest price per weight/volume. This is usually available on the sale ticket. Sometimes buying bigger packs will deliver better value for money, but this isn’t always the case so it’s worth checking.
- Make the most of discount codes and cashback– When you’re shopping online, whether for essentials or a little treat, get into the habit of checking for discount codes or deals to reduce the cost of your basket. Or, better yet, install a browser plugin like Honey (which is free), and it’ll do the legwork for you! You can also shop through a cashback site to make a bit of money back when you buy everything from groceries to gardening supplies. Top Cashback reckon you could make over £300 a year by doing your shopping through them!
- Check your contracts – Millions of us are thought to be paying over the odds for things like broadband, mobile phones and pay-TV because we’re out of contract. Your providers have to let you know when your contract is coming to an end and keep in touch to let you know if a better deal is available. But, you can still shop around yourself to find the best deal, and potentially save hundreds of pounds!
- Consolidate your debt – According to The Money Charity, the average household has £64,581 in debt (including mortgages). Debt consolidation won’t reduce your total debt, but could decrease how much you pay towards it monthly by combining what you owe into one loan, with one, often lower, interest rate. Even considering that you can’t usually include mortgage payments in a debt consolidation loan, you may still be able reduce your monthly outgoings. If consolidating your debts means extending the term of your borrowing, though, you may pay more interest in the long run.
- Bag a freebie and cut food waste – Apps like Olio are a great way to get your hands on free food and household products that others – including Tesco and Pret – have going spare. There are no guarantees on what’ll be available at any given time, but, if you check the app regularly, it’s likely you’ll find all sorts of useful, tasty and most importantly, free food. This can help you cut your grocery spend and do your bit to reduce waste as an added bonus.
For more money-saving ideas, see how you get on with these 100+ ways you can save money.
Methodology
We looked at how prices have changed over the last 50 years, or, if consistent data was not available for that period, for 25 years, for 13 items, using ONS and land registry data as far as possible, and then used an inflation rate calculator to determine what today’s costs could be, vs what they are.
Where “home” and “house” prices are mentioned, these terms refer to all types of residential dwellings, including but not limited to:
- purpose built flats
- flats in converted buildings
- maisonettes
- terraced houses
- semi-detached houses
- detached houses
- bungalows
How we calculated inflation
We’ve used the long run Retail Price Index (RPI) series, compiled and maintained by the ONS as the basis of our inflation calculations, using data from the 17th August 2022 data release. This is because Consumer Price Index (CPI) data is only available from 1988 onwards, and many of our price comparisons pre-date this.
To work out the average rate of inflation over a set time period, we calculated the percentage difference in each year’s index, and then calculated the average of these over the desired period of time.
And, to work out the value of goods had their price risen solely in line with the rate of inflation calculated, we used this formula:
The sum of money, multiplied by [later date index divided by earlier date index]
For example: £20 x (736.9 [June 2004] / 215.9 [May 1979]) = £68.26
Main sources
https://landregistry.data.gov.uk
https://www.ons.gov.uk
https://www.gov.uk
https://www.ofgem.gov.uk/publications/default-tariff-cap-level-1-april-2022-30-september-2022